

2027 goals
We attract a high-quality audience that is representative of all user markets
visitors
+
0
international visitors
0
%
_01.Target sectors
8 DEMAND SECTORS
Packaging, a cross-cutting solution
Packing and packaging constitute a fundamental strategic sector in industries that need to constantly transform and find solutions to the new challenges involving the sustainability, safety, functionality and preservation of their products.
Food and drinks
FOOD AND DRINKS
Innovation forms part of the DNA of the food industry and packaging is one of the main pillars of the transformation process.
Chemicals
CHEMICALS
With important challenges in terms of sustainability and safety, the sector is looking towards packaging in order to find new solutions.
Cosmetics and perfumery
Cosmetics and perfumery
Packaging should constantly reinvent itself and seek excellence and new materials which, in addition to being functional, must be capable of surprising the consume.
Medicinal products
MEDICINAL PRODUCTS
Packaging must resolve new issues concerning the functionality, dosage and preservation of the product.
Pharmaceutical products
PHARMACEUTICAL PRODUCTS
The sector is facing new challenges at the point of sale and in terms of the creativity and innovation of its packaging.
The automotive sector
THE AUTOMOTIVE SECTOR
The search for increasingly smart packaging, coding and handling solutions is essential for this industry.
Industrial goods
INDUSTRIAL GOODS
The need to optimise costs and be efficient without undermining quality and safety obliges us to constantly innovate.
Other non-food sectors
OTHER NON-FOOD SECTORS
Packaging, maintenance and storage solutions that help to optimise the supply chain of any productive activity.
41,70%
END PRODUCT MANUFACTURERS
- 41,8% Food
- 57,7% Non-Food
- 0,5% Food & Non-Food
56,20%
OTHER SECTORS
- Engineering
- Design
- Logistics operator
- Graphic Industry
- Machinery manufacturer
- Materials manufacturer
- Machinery distributor
_02. Visitor profile
Qualified professionals with high decision-making power
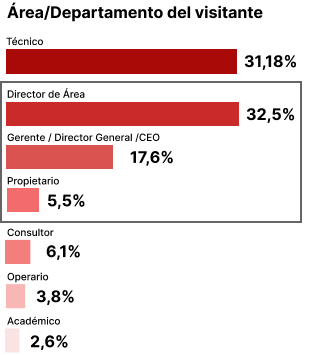
Our visitors have significant decision-making power: 46% make purchasing decisions and 55.5% hold management positions.
_03. Top companies by turnover
Attendance rate for the 25 leading companies by turnover in Spain.
| FOOD | |
|---|---|
| Bakery, Pastry and Confectionery | 80% |
| Dairy products | 60% |
| Meat | 60% |
| Drinks | 60% |
| Oil | 36% |
| Fruits and vegetables | 28% |
| Fish, seafood and preserves | 24% |
| NON-FOOD | |
|---|---|
| Perfumery and cosmetics | 88% |
| Pharma | 64% |
| Chemicals | 60% |
| Automotive | 40% |
| Consumer electronics | 16% |
_04. International visitors
International visitors
0
%
_05. Visitor satisfaction
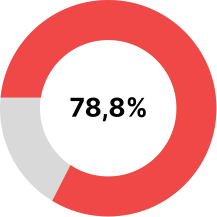
VERY SATISFIED AND SATISFIED
Source: Surveys conducted by Fira de Barcelona.